How Accurate Is Korea's Public CCTV Dataset? What I Found Building a Nationwide CCTV Map
TL;DR
- Korea's published CCTV count is not the real camera count: private and undisclosed cameras are missing, while shared coordinates inflate site counts.
- The raw 381,036 rows add up to 700,548 cameras, and 55,704 coordinates are registered more than once.
- 42.5% of install dates are blank, and placeholder coordinates like 36.0/127.0 and install dates from 1899 show up.
- Base dates range from 2020 to 2026, so cite the numbers together with their scope and base date.
 See CCTV near you on ViewconeOpen the map
 While building Viewcone - a public CCTV map - I cleaned the entire national CCTV standard dataset from Korea's Ministry of the Interior and Safety. Working through it answered a question naturally: does the published CCTV count equal the real number of cameras? Short answer: no. But the reasons are more interesting than expected, so here are the actual numbers.
The dataset
| Item | Detail |
|---|---|
| Dataset | 전국CCTV표준데이터 (National CCTV Standard Data), Ministry of the Interior and Safety |
| Format | CSV, EUC-KR encoding |
| Total records | 381,036 |
| Key columns | management ID, agency name, address, purpose, camera count, install year-month, WGS84 lat/lon, data base date |
| Providers | 228 municipality codes, 1,835 agency names |
This file is not a single national snapshot. It's a union of records each municipality and agency uploads on its own schedule. That difference explains every problem below.
What I found
1. One row is not one camera
Each row is an installation point. A separate column holds the camera count, and summing it gives 700,548 cameras across 381,036 rows - the camera total is 84% higher than the row count. Multiple cameras often share one pole; the maximum camera count recorded in a single row was 201. When a headline says "Korea has X hundred thousand CCTVs," the number can differ by almost 2x depending on which figure is used.
2. 55,704 coordinates appear more than once
Grouping rows by lat/lon rounded to 6 decimals turns up 55,704 coordinates used by at least two rows - 182,569 records in total, nearly half the file. I first assumed these were agencies double-registering the same install, but a closer look says otherwise: every row carries a different management ID. One Seoul alley, for instance, has six consecutive IDs sharing the same address, same coordinates, and same install month - likely separate installations recorded as their own rows while sharing one representative coordinate - probably geocoded at the address level or copied wholesale.
So Viewcone merges rows sharing a rounded coordinate, purpose, and agency into a single point - they'd land on the same pixel anyway - but sums their camera counts. That merged 122,625 rows into 258,385 map points / 700,465 cameras. The math checks out: 700,548 − 83 (cameras on out-of-range rows) = 700,465.
Worth noting: the first version of the pipeline kept only the first record and threw away the rest of the camera counts - an undercount I fixed once I saw that the management IDs were all distinct.
3. Dummy coordinates pointing at one inland spot
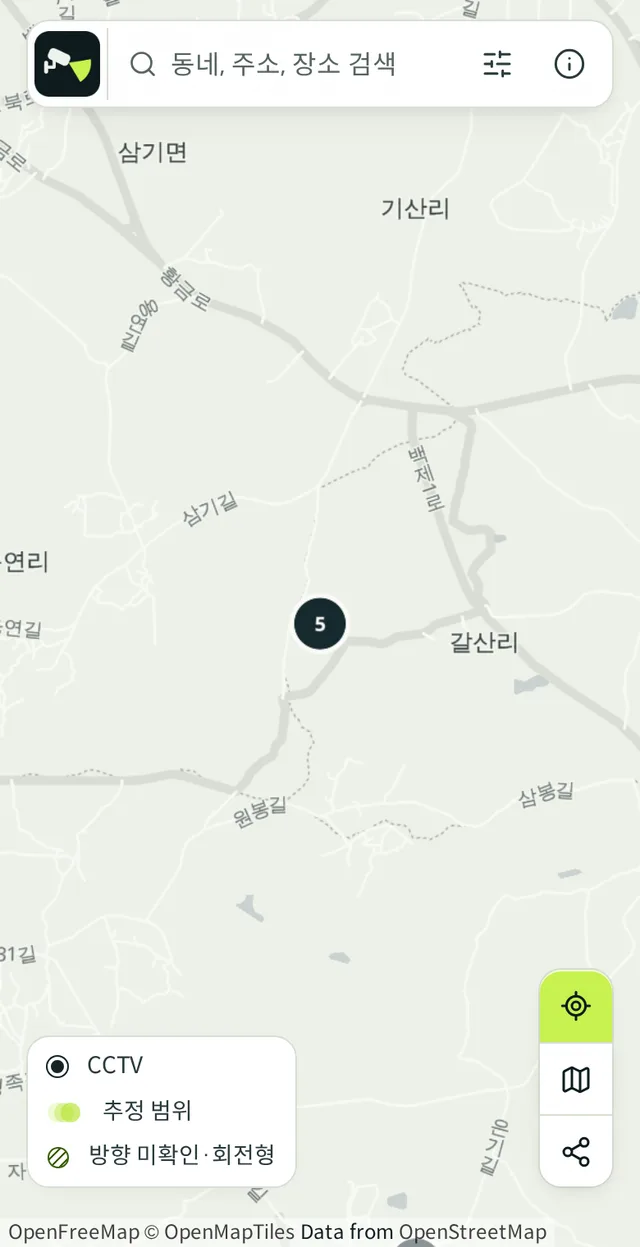
1,579 rows sit at exactly 36.00000, 127.00000 - and 990 more at 36.1/127.1. Clean round numbers, strongly suggesting placeholder values rather than measured coordinates. About 2,984 rows have these "rounded" coordinates. They pass the filter since the spot falls inside the configured bounds, so on the live map thousands of records still pile onto one inland location.
Beyond that: 26 rows fall outside the configured bounding box (lat 32-39.5, lon 123-132), and roughly 4,970 rows (~2%) point to a different province than the managing agency's.
4. 42% of install dates are blank - and some say 1899
The install year-month field is empty in 162,131 rows (42.5%). About 2,200 contain only a year ("2026"), and over a hundred read 189912 or 190001 - consistent with spreadsheet artifacts, like a default date near January 1900 leaking through a date-to-number conversion.
5. Four spellings for the same thing
The shooting-direction field is empty in 48% of rows (181,932), and filled values spell "360-degree" four different ways: "360도 전방면", "360도", "360도 전방", "360도전방면". Retention days show 30 days for 80.8% of rows but range from 0 to 40, with 61,788 blanks.
6. Each agency's data lives in a different month
The data base date column spans January 2020 to September 2026. Seoul's most common base month is 2026-05 while Gangwon's is 2024-07, a 22-month gap, so "national CCTV status" is really snapshots spread across roughly six years and eight months. The full breakdown for all 16 regions is in How fresh is Korea's public CCTV data?
Why this happens
The standard data program works like this: the ministry defines the schema, each agency fills it in. 228 municipal codes, different staff, different update cycles, different input habits. The format is shared but the interpretation isn't - whether "one point" means one camera or one pole varies by agency. Coverage varies too: private CCTV, cameras managed directly by police or military, and non-disclosed installs are simply absent.
What to keep in mind when reading the numbers
- Published count ≠ actual camera count. It undershoots by excluding private and undisclosed cameras, and overshoots on locations due to duplicate registration. The error runs both ways.
- Check base dates before comparing regions. Putting a 2024 snapshot next to a 2026 one bakes two years of new installs into the comparison.
- "Cameras per 100k residents" style metrics need the same coverage caveat. The regional breakdown shows how much these conventions skew raw counts.
How Viewcone handles it
Before anything reaches the map, the pipeline:
- Validates coordinates - drops anything outside the configured bounding box (lat 32-39.5, lon 123-132)
- Placeholder coordinates are still unsolved - values like 36.00000/127.00000 sit inside those bounds, so they reach the map as-is; a dedicated filter is on the to-do list
- Collapses shared coordinates - rows with the same coordinate, purpose, and agency become one point, while their camera counts are summed
- Normalizes columns - "360도 전방" and friends map to standard codes
- Keeps attribution - the source and base date stay visible next to the numbers
The map therefore shows cleaned points and camera counts, not raw row counts. Remaining error - absent private cameras, uneven agency coverage - can't be fixed from our side, so the map states that limitation explicitly.
Wrapping up
The public CCTV dataset is better understood as a stack of snapshots each agency published at its own point in time, not a complete list of every camera in the country. The numbers are useful - but row count isn't camera count, and the whole nation isn't measured on the same date. Cite the coverage window along with the figure.
Methodology
Analysis ran on the CSV downloaded 2026-09-20 (381,036 rows). Coordinates were compared after rounding WGS84 lat/lon to 6 decimals, combined with purpose and agency; the bounding box is lat 32-39.5, lon 123-132. Province mismatch compares the administrative region containing each coordinate against the agency's home province.
All figures reflect that snapshot and will shift as the source refreshes.
Source
- 전국CCTV표준데이터 - Localdata (Ministry of the Interior and Safety)
- Analysis uses a file downloaded 2026-09-20
FAQ
Are there cameras missing from this dataset? Yes - privately installed CCTV (shops, apartment complexes) and cameras withheld for security reasons aren't included.
Why does Viewcone show fewer points than the raw file? Rows sharing a coordinate, purpose, and agency occupy the same pixel on the map, so they collapse into one point - but their camera counts are summed, so the total only loses the 83 cameras on out-of-range rows.
How fresh is the data? It depends on the agency - base dates inside a single file range from 2020 to 2026.
See CCTV near you on ViewconeSearch a neighborhood or address to see public CCTV locations and estimated coverage. Free, no sign-up.Open the map